Today, in this “Qlik Sense Mashup” blog series, I will be exploring another simple concept and add to the context covered in my previous post of this series.
In my first post of this series, I showed how easily we can embed Qlik Sense visualisations to any HTML page. This time we will expand on this idea and look at Identity feature of embedded analytics.

What is Identity?
“Identity” in Qlik Sense embedded analytics is a way to manage sessions of your visualisations. In Qlik Sense, users make selections in charts and that selections get applied across all objects in the application. This is the usual behaviour of the Qlik’s associative engine we all love and familiar with. However, at times, we may want to do things bit differently. May be, the users want to compare a collection of measures side by side with different set of filters, or simply make a chart ignore the selections. We can use combination of set analysis and alternate states to build these features in the Qlik Sense Client.
In the world of Qlik Sense mashup, we have our work cut out. We do not need to create any alternate states in the application or write set analysis to achieve this, we simply use the “Identity” instead. Identity gives the visualisations a session. Charts with the same identity will share the selections while others will not be affected by them. Essentially allowing us to create “alternate state” without having to create one in the source application.
How to use Identity
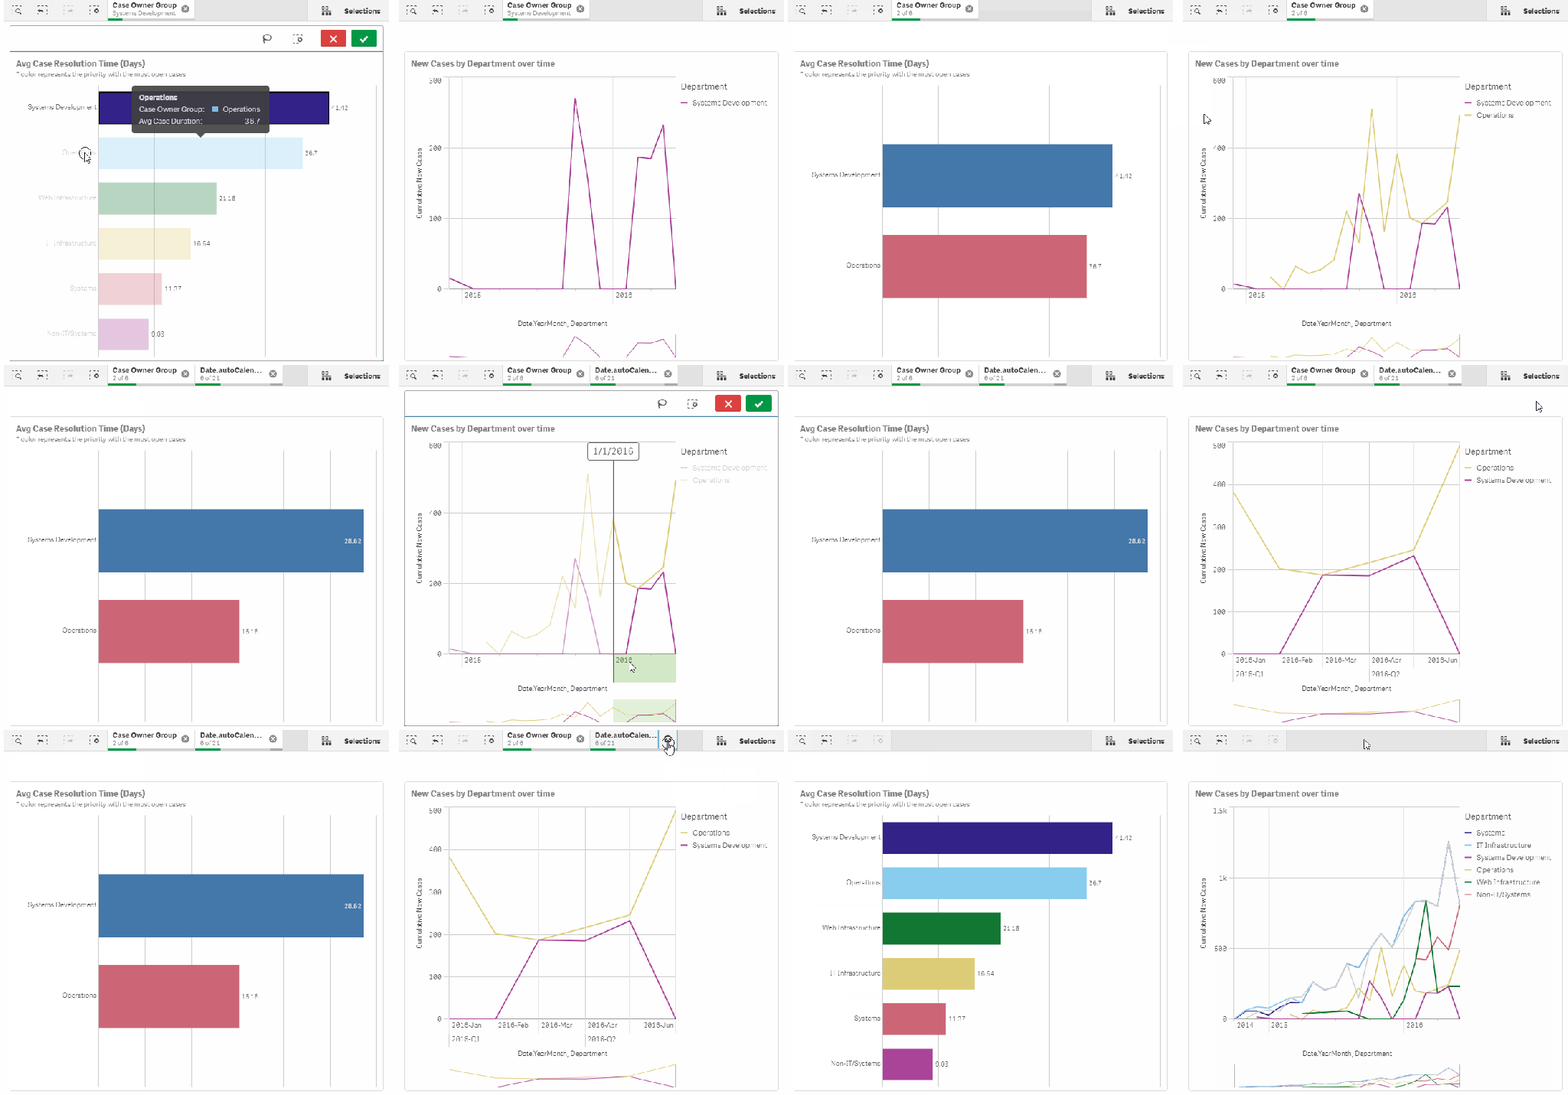
Say, you have a view/page with two charts (“Chart A” and “Chart B“) as shown in the example below. If you make a selection on “Chart A“, you will see the same selection gets applied to “Chart B“. This is the usual behaviour that we are used to in Qlik Sense.
<div class="column col-xs-8">
  <iframe src='http://qlikserver/single/?appid=xxxxx-xxxx-xxxxxx-xxxxx-xxxx&obj=RpcPpj&opt=currsel&select=clearall&theme=card' style='border:none;width:100%;height:100%;'></iframe>
</div>
<div class="column col-xs-8">
  <iframe src='http://qlikserver/single/?appid=xxxxx-xxxx-xxxxxx-xxxxx-xxxx&obj=aaSUPb&opt=currsel&select=clearall&theme=card' style='border:none;width:100%;height:100%;'></iframe>
</div>

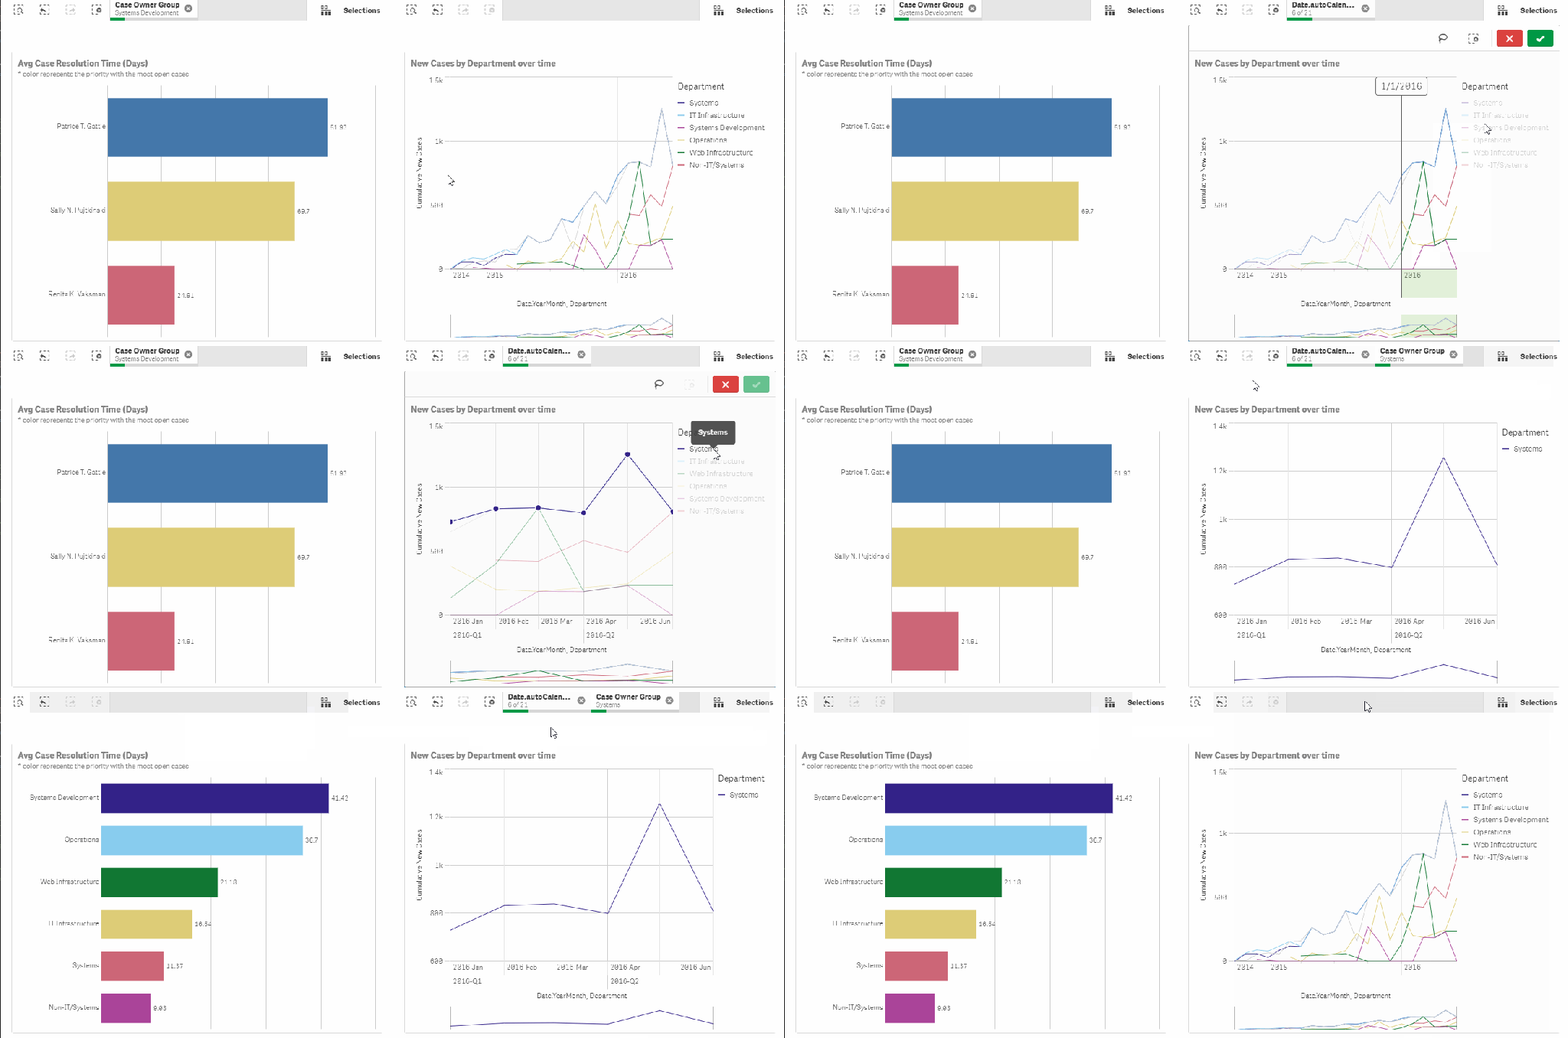
Now, you want to make a change to this behaviour and you want the selections made in “Chart A” not to affect “Chart B“. The way we can do this in mashup is by simply introducing “Identity” to assign a session id to our visualisation. We will take the above example and add identity=chart1 in the iframe src at line 2 and add identity=chart2 in the iframe src at line 5. This will put our charts into their own sessions. Now selection made on one chart will not have any affect on other chart, as the example shown below.
<div class="column col-xs-8">
  <iframe src='http://qlikserver/single/?appid=xxxxx-xxxx-xxxxxx-xxxxx-xxxx&obj=RpcPpj&opt=currsel&select=clearall&theme=card&identity=chart1' style='border:none;width:100%;height:100%;'></iframe>
</div>
<div class="column col-xs-8">
  <iframe src='http://qlikserver/single/?appid=xxxxx-xxxx-xxxxxx-xxxxx-xxxx&obj=aaSUPb&opt=currsel&select=clearall&theme=card&identity=chart2' style='border:none;width:100%;height:100%;'></iframe>
</div>

All objects with the same identity will share the selections in that session, this allows you to create and manage charts with different selection states. Opens up the options for on the fly comparative analysis to be build without having to add complex set analysis or create multiple alternate states in the source Qlik Sense application, and all of this can be done without any JavaScript.
Next…
Next time I will explore Qlik Sense mashup deployment scenarios and dev-hub in Qlik Sense.
Meanwhile, please feel free to share your thoughts and ideas, here or at any of my social media channels – Twitter or LinkedIn.