Introducing SnapChart – from picture to data visualisation

SnapChart introduction

This year has been another strange year for sure. Covid continues to cause disruptions all around the world, we have gotten used to the reality of swapping our sunny holiday destinations for a tent in our back garden, panic buying became a quarterly trend (remember this?) and we learnt to go for weeks without seeing our loved ones. But in the midst of it all, there were some positives.

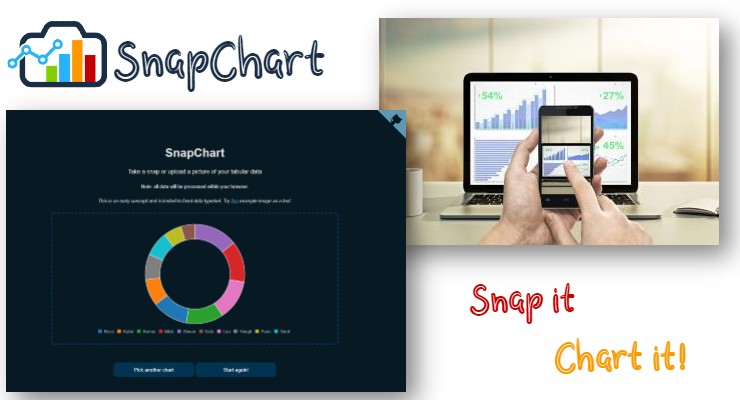
Continue reading “Introducing SnapChart – from picture to data visualisation”

Data Literacy at school

Data Literacy by Kabir Rab

In my previous blog, I talked about my son’s data literacy journey, how it all started and how his interest in this topic led to many conversations at the school playground. That got me thinking, whether this idea can be replicated to workshops for his friends and other classes in the primary school. This would be the perfect time to help these young kids become aware of the data footprints that they are creating and equip them with means to read, understand and analyse it.

Continue reading “Data Literacy at school”