This year has been another strange year for sure. Covid continues to cause disruptions all around the world, we have gotten used to the reality of swapping our sunny holiday destinations for a tent in our back garden, panic buying became a quarterly trend (remember this?) and we learnt to go for weeks without seeing our loved ones. But in the midst of it all, there were some positives.
Businesses are now more flexible with where their employees work from, as a society, we are now talking more openly about our mental well being, people are enjoying taking a walk in nature.
2021 for me has been a rollercoaster of a year. I have been busy with lots of new technologies, Snowflake, AWS, Qlik Application Automation, Qlik Forts, Power Automate, Airtable are just to name a few. That (and summer full of cricket) kept me busy for sure, hence why I haven’t had much free time to blog. I have been looking forward to some downtime during this holiday period to say the least.
Holiday project
It’s a tradition that I have followed for the last few years now. I put aside three projects, usually they are projects that I want to do with our boys. But since this year has been a busy year, my list of projects were rather long and I ended up picking one project that evolves around data and did not include doing it with our kids (sadly). I felt very strongly about this project because of its link to data literacy which made it harder to ignore.
Mastermind behind the idea

I cannot take the credit for the original idea. This came from my colleague at Tahola, Kenny Balding. One of our usual long Teams call turned into a conversation about personal projects, and this is when Kenny shared his idea on creating an application which can turn picture into chart.
It would be great to build an application which allows people take a photo of a tabular data set and turned that into a chart.
-Kenny
And that was it, that’s all I needed to hear. My mind started to tick away, I started to think about how it will work, we discussed the topic of data privacy etc. Kenny made another key point there, he wanted to achieve this without any cloud Machine Learning platforms/APIs or backend server processing, essentially, run this all within the user’s browser/client. We googled for Optical Character Recognition (OCR) JavaScript libraries and that’s when we found Tesseract.js. it’s a JS library based on tesseract-OCR engine which can identify words from a picture and the beauty is, this JS library can do this all within the user’s browser.
The usual why…
That afternoon I left the teams call with lots of ideas about how we can achieve this together and learn something new in the process. However, as usual, we both got busy with our work and this became part of my list of things I would like to do. So, when picking projects for this holiday season, this felt like the perfect one for many reasons –
- It will be a relatively simple project to work on (or at least that’s what I thought!).
- Although I knew that I won’t be able to do this with Kenny over the holiday period, however, my nephew, who is studying Maths and Statistics at university, will be very happy to get involved. It’s a great opportunity to nurture a young mind in all things data and it seemed like the ideal project.
- This project aligns with my data literacy teaching goals. This has the potential to reach many people and with it, creating charts will become a lot more accessible to anyone who wants to tell a story with data visualisations.
How?

I already had some idea on how I can tackle this project. I wanted to keep the project simple. So I decided to leverage my existing Kids in Data project for all the charting requirements (based on c3.js, a wrapper for D3) and instead of using any framework, I will use plain JavaScript, making it accessible for anyone familiar with JavaScript. The whole solution would be a Single-page Application (SPA) build using nothing but HTML, CSS and JavaScript. For development purpose, we will run a node.js (express.js) web server to serve the application.
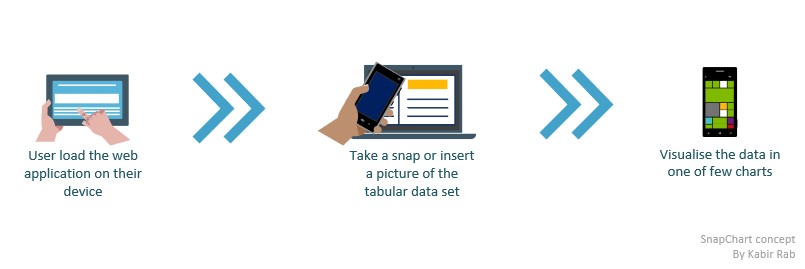
The usage of the app would be rather simple –
- User will load the web page on their device.
- Take a snap of a tabular data or upload an image containing the data.
- Tesseract will extract that data and if successful, present the user with a few chart options.
- User will see their tabular data in the chart of their choice.
We had all the conceptual work done (in my head), now all we need to do is put that into practise. I recruited my nephew (Mahdi Ahmed) to help and got on with the tasks in hand.
The result…

After a few hours of tweaking around with the output from the Tesseract engine, we were able to map that data into an object that I can pass on to our charting library and create the visualisation. Since it was an early concept, we hard coded some charting elements which means this version only works with the column name “Names” and “Scores”. We also noticed that accuracy of the engine was not always reliable, which means in the future, this needs to be improved. A few hours work resulted in the demo shown above. You can try this at the GitHub pages here.
What’s next..
If I get any spare time in the near future, I would like to implement some more steps to make data recognition process (e.g. handle column separator by splitting the image by columns etc) more robust and make the chart elements fully dynamic.
There are many things that can be done with this. This concept can be integrated to Azure Cognitive Services (or similar services from other vendors) and build a more complex solution which allows users to create charts at ease. I hope this inspires someone to take it to the next level. I would be happy to turn this into an open source project for all the data literacy geeks out there, if any are interested.
This is all the time I have for today. Thank you all for taking the time to read my many blogs on crazy/pointless ideas. I wish you all a safe and happy new year for 2022.
