In my previous blog, I talked about my son’s data literacy journey, how it all started and how his interest in this topic led to many conversations at the school playground. That got me thinking, whether this idea can be replicated to workshops for his friends and other classes in the primary school. This would be the perfect time to help these young kids become aware of the data footprints that they are creating and equip them with means to read, understand and analyse it.
So, I decided to speak with the school about running a few workshops. Ideally, I would like to mix the learning with some type of game to make the experience more fun and engaging and, to my surprise, the school loved the concept and wanted to go ahead with the idea. I agreed to run the workshops and started thinking about making this concept a reality.
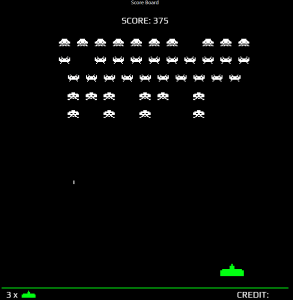
The first challenge I faced was finding a game that requires no installation and can be played on any internet browsers. The game needed to be fun, something the kids and parents are familiar with. After a lot of back and forth, I ended up choosing “Space Invaders”. It is well known across generations, fun to play and can be played on browsers.
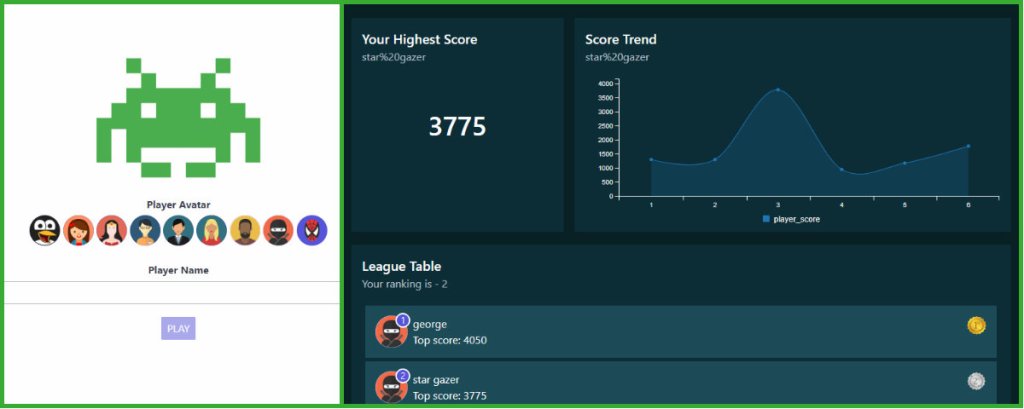
The next challenge was to capture the data from the game. So I started building a back-end API to work with the game, which helped me to capture the data and save it for analysis. I also expanded the game to allow users to select an avatar and their “in game name” (IGN), which enabled me to build the league table for the game.
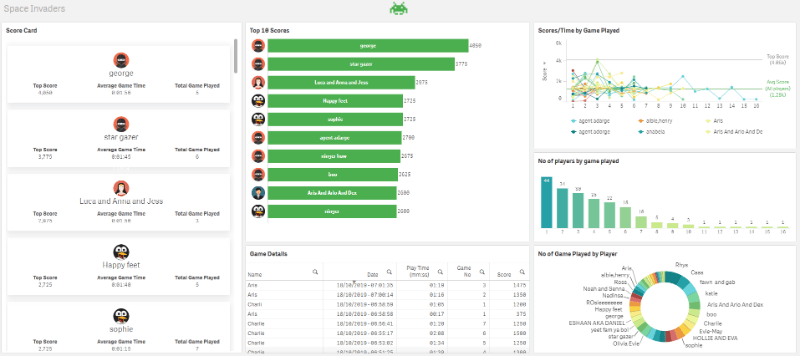
The next task was to build a data analytics layer, which I can use to teach the kids about data visualisations and how to interpret different charts, including how and when to use them. I picked Qlik Sense for that task and used the native REST connector to get the data to the dashboard via the API I built. I used some of the easy to understand in-built visualisations and utilised some of the extensions I built previously for Aaron for his data literacy beginning.
At this point, I had a game for the workshop that kids can play, a league table in the game so they can have a friendly competition and a Qlik Sense dashboard from which they can learn about the data they have produced with the game, however, running these workshop with sixty 7-11 years old on my own would be challenging to say the least. I needed some help. So I turned to non other than the person who put the seed on teaching others about Data Literacy in my head, someone I look up to, my colleague/mentor Ross White (@rossmwhite), and to my relief, Ross was happy to help. Tahola also agreed to sponsor the event and provided their infrastructure to run the game and API on.
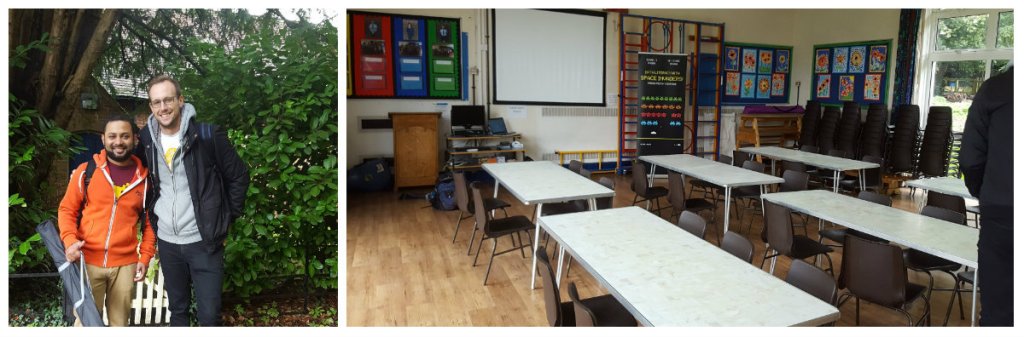
Now that I have the team in place, we contacted the school and set the 17th of October as the date for the workshops. The date arrived, the hard work had been done, Ross and I went into the school with no idea what level of interest/response we will get from the children. However, when we walked into the class room full of very excited kids, I knew this was going to be a fun day. Ross very quickly got the class under control and, after a lot of running around between the kids’ laptops getting them setup, they were all playing the game. There was a lot of laughing and chattering, so we knew they were having fun and amongst it all we saw team work and lots of friendly competition.
Once they have played enough games for us to run some analysis on, we fired up our Qlik Sense dashboard. Ross started to take them through the dashboard, asking them series of questions and presented different charts to help with their answers. Very quickly we saw the children answering the questions at ease….they were getting proficient at reading and understanding the charts. This is exactly what we wanted from these workshops.
“If this table gives us all the details of each game played, then why do we need those other charts?”
asked by a bright young pupil
This one question stuck with me, this definitely gave me the opportunity to explain in detail, the need for other charts and how each chart can help one to get certain insights very quickly, which would not be so obvious from raw data alone. Anyone who works/worked in BI, had to face similar questions at one time or another in their career. This is a brilliant opportunity to teach the younger generations and start them of their data literacy journey, helping them become proficient using data visualisations to find insights and answer questions, so that in the future they are better equipped when they venture into the wider world.

At least the bright young pupil didn’t put his hand up and ask “Can I export that table to Excel?”.
LikeLiked by 1 person
If we can educate them from an early stage of their lives, we will see less of that behaviour.. or at least one hopes!
LikeLike