2020-03-06 UPDATE: Added daily UK feed including total tested figures, GitHub and Azure Notebooks both have been updated.
With the spread of coronavirus and the general panic around it, it’s hard not to ask or hear questions like –
- How many people have been infected so far?
- How many people recovered?
- Wonder how many people have lost their loved ones?
- Which countries’ been affected so far and in what rate?
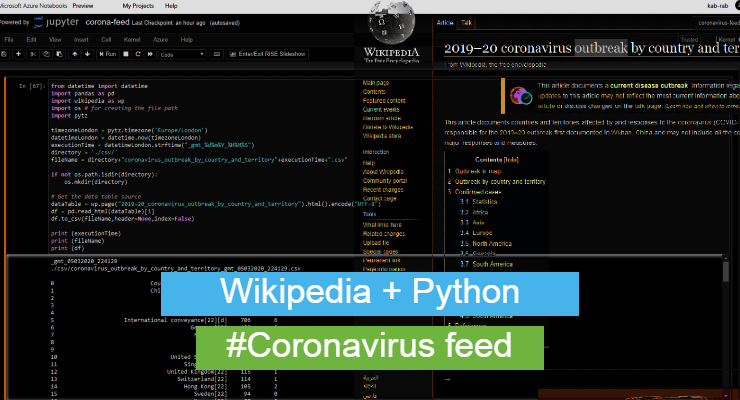
TLDR: A python script to scrape Wiki table to get up-to-date summarised information on coronavirus outbreak. The link to my Azure notebooks (Jupyter hub) or GitHub.
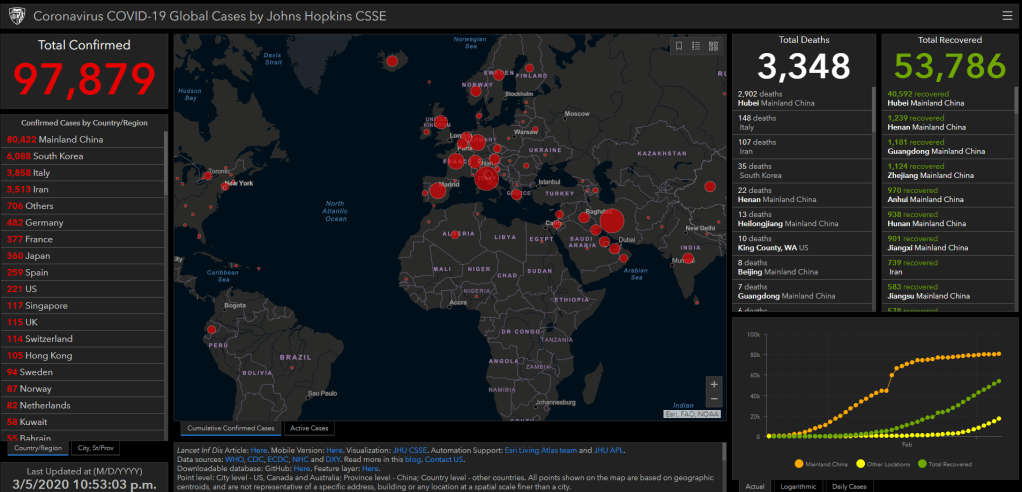
Being a data geek – my initial thinking was, I should build a dashboard that gives me these information. But very quickly I realised, there are lots of the stats flying around and there are some really good dashboards (ex – from Johns Hopkins CSSE) feeding us the data we need to stay informed and up-to-date with the outbreak.
However, I noticed, not all of these contained the latest information, and that ones did, they are not really lightweight or not always mobile friendly. So, I started looking to see how I can get the latest summarised information. There are some GitHub projects doing some wonderful work, but they are providing more information then I wanted for a light weight feed.
I came across Wikipedia feed in my search, and monitored that feed for a short while to see how up-to-date that feed is. I found it was receiving update a lot quicker than ECDC (European Centre of Disease Prevention and Control) and some other source I was tracking.

So, I decided to roll up my sleeves and get a quick python script together and capture that data in an interval to get my light summarised feed that I wanted. I originally started the project with beautifulsoup, requests and pandas in mind to achieve what I needed to do. Requests to get the HTML from the Wikipedia page, beautifulsoup to pick the table from it and finally pandas data frame to tidy everything and put that into a csv file.
Then I thought, there must me a quicker way to get this done. A little bit of research gave me the answer – I can do it all using pandas and wikipedia. It took me all of 10 minutes and I had a working solution. Much easier and quicker than trying to do this on beautifulsoup (or at lest for me). Here is the final outcome of the 10 minutes! I setup the project on Azure Notebooks (its essentially Jupyter hub on Azure) so I can share it easily. (GitHub too)

Now that I have the data extract, all I had to do is push that script to my Raspberry Pi and schedule it with CRON. I am currently refreshing the data once per hour and have a HTML view on top of it that I can see from my phone. I thought I would share this script, others might find it useful and can put it to a much better use by building perhaps another great Qlik Sense dashboard. And Yes – I am aware, I could have done all of it in Qlik and probably much quicker!

Thanks for sharing such a great article.
LikeLiked by 1 person